Example Datasets and Workspaces
Tabular Data Examples

To illustrate the tabular and astronomy-specific capabilities of AstronomicAL, two example layouts are provided: one focused on imaging and photometry, and another focused on spectroscopy. The above gif shows how you can dynamically switch between layouts on-the-fly.
Both layouts use EDFN_example_data.fits, which contains a small subset
of sources drawn from the Euclid Deep Field North catalogue presented by
Euclid Collaboration: Matamoro-Zatarain et al. (2025). Sources with DESI
counterparts were selected and then randomly subsampled to keep the file size
below 5 MB.
For the same reason, only a subset of catalogue columns was retained. These include template-fitting photometric measurements converted into magnitudes, a selection of colour combinations, source coordinates, and the information required by the example spectroscopy panels.
The accompanying EDFN_photometric_bands.json file defines the
photometric filters used by the Broadband SED panel.
Layouts and Datasets
AstronomicAL can save the arrangement of panels together with supported panel settings, dataset information, and column mappings in a JSON layout file.
A saved layout can later be loaded to reconstruct the workspace without manually reopening and configuring each panel.
Note
The dataset itself is not stored inside the layout file. Load the associated dataset separately before or after loading the layout. Dataset mappings and panels are restored when the required data become available.
Photometry Layout
The photometry_layout.json example focuses on imaging and photometric
data. It opens on a bright, nearby galaxy at approximately
\(z \sim 0.05\).
The workspace includes a Broadband SED showing photometry from the external ground-based \(u\), \(g\), \(r\), \(i\), and \(z\) bands, together with the Euclid NISP \(Y\), \(J\), and \(H\) bands.
It also includes 15-arcsec cutouts in the Euclid VIS and \(Y\) bands, allowing the different spatial resolutions to be compared.
A density plot places the focused source in colour–colour space relative to the rest of the loaded sample, while a histogram compares its VIS magnitude with the distribution of the population.
Spectroscopy Layout
The spectroscopy_layout.json example focuses on spectroscopic
inspection.
In addition to the VIS image and Broadband SED, the workspace displays the optical DESI spectrum and the near-infrared Euclid NISP red-grism spectrum of the focused source.
The spectrum clearly shows Hα (\(\lambda 6564\)) and [O III] (\(\lambda\lambda 4959, 5008\)) emission lines.
The example source was selected to have a high signal-to-noise ratio in both the Hα line and continuum, together with a spectroscopic-redshift reliability greater than 0.999.
Image Data Example
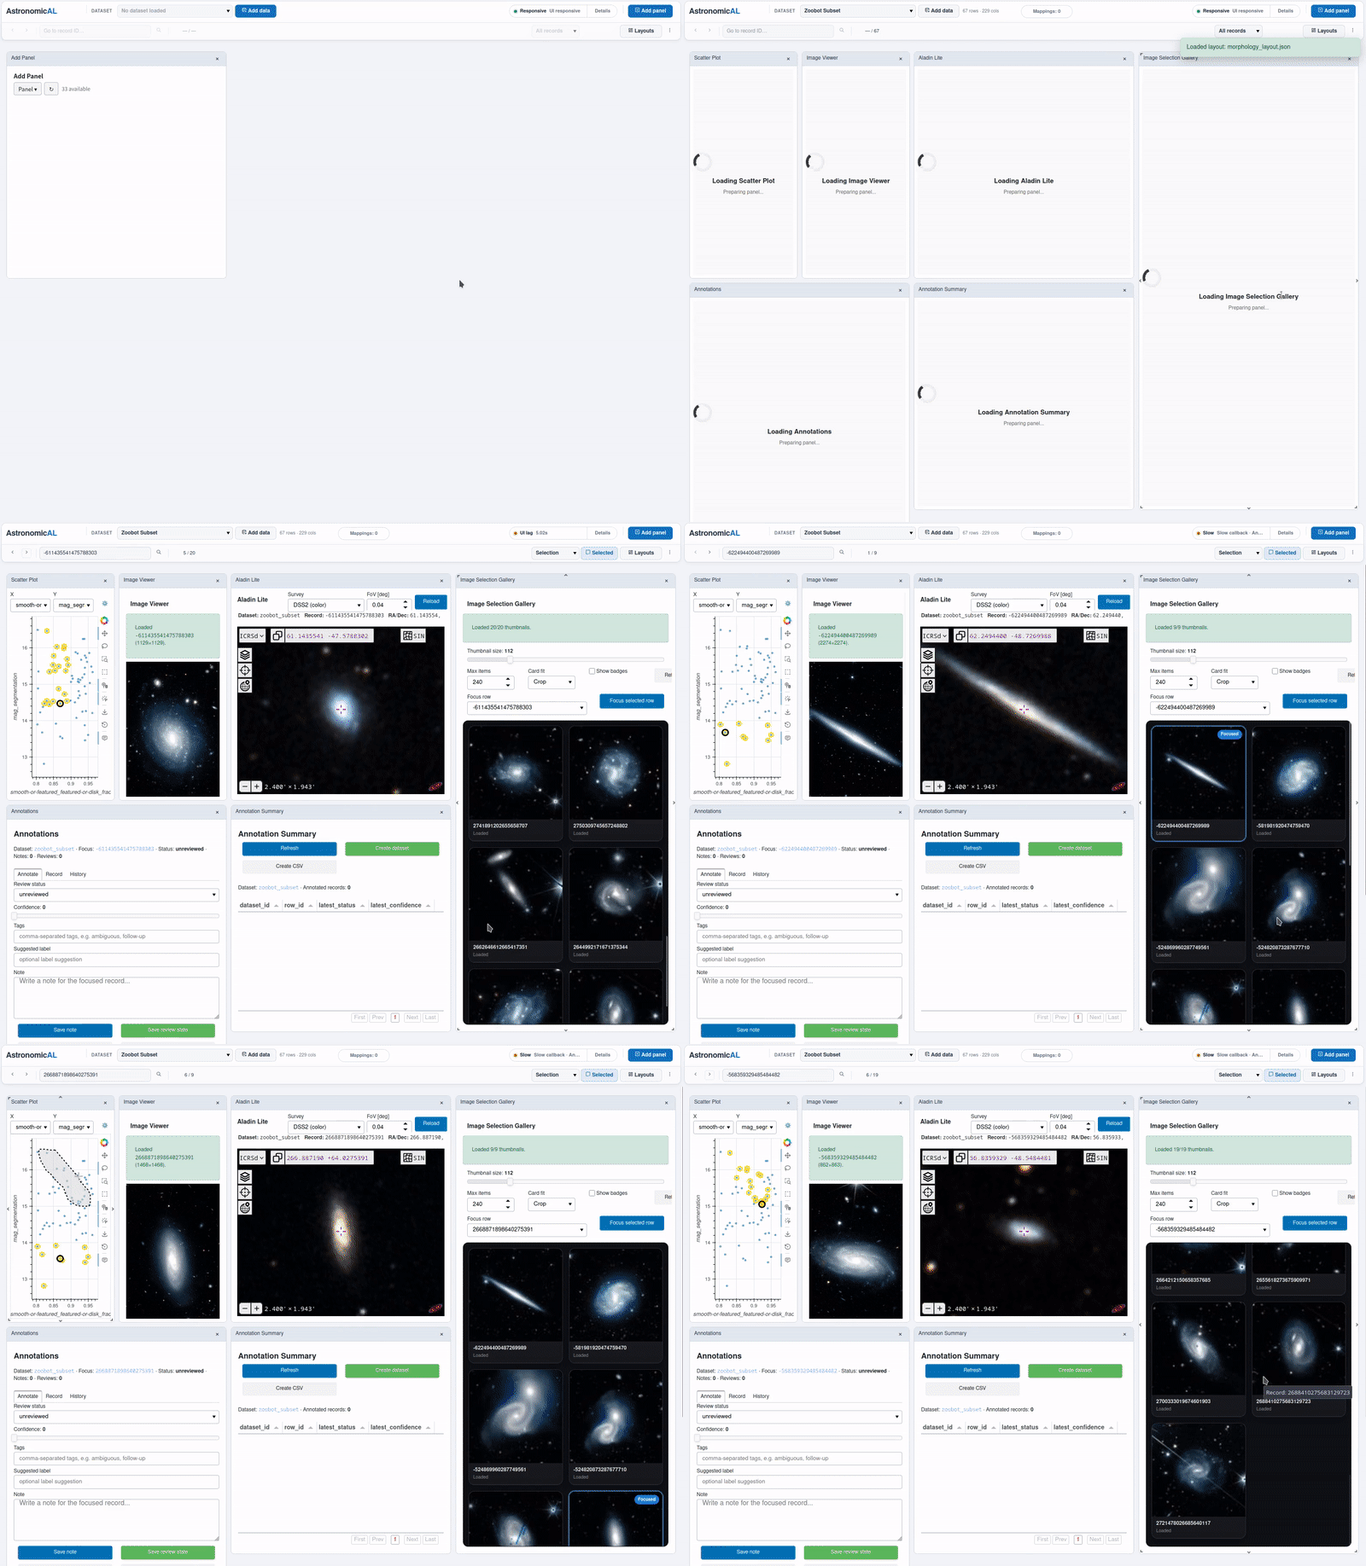
The zoobot_subset.fits and morphology_layout.json files provide
a second type of example, centred on visual inspection and galaxy morphology.
The zoobot_subset.fits dataset is a subset of the catalogue provided from Walmsley et al. 2026. providing zoobot predictions and image cutouts of Euclid Q1 data. This subset contains 67 example records and 229 columns. In addition to source identifiers and sky coordinates, it provides the tabular information used to explore morphology-related measurements and associate each record with its corresponding galaxy image. AstronomicAL itself was used to choose this particular subset from the larger original catalogue by selecting a visually interesting sources using the scatter plot, galaxy zoo columns and the image gallery.
The small size of the example makes it practical to demonstrate workflows where many source images are inspected together rather than examining records only through catalogue columns.
Morphology Layout
The morphology_layout.json workspace combines several linked panels:
Scatter Plot for comparing catalogue and morphology-related quantities;
Image Viewer for inspecting the image associated with the focused record;
Aladin Lite for viewing the same source in its surrounding sky context;
Image Selection Gallery for browsing multiple source images at once;
Annotations for recording review information for individual records;
Annotation Summary for reviewing and exporting the resulting annotations.
The example Scatter Plot compares a morphology-related quantity with the segmentation magnitude. Records selected in the plot are highlighted and become part of the platform selection set.
Image Selection Workflow
The Image Selection Gallery displays thumbnails for multiple records in the current selection.
Because the panels share the same platform focus, changing the focused record also updates the Image Viewer and Aladin Lite panels. The user can therefore move between catalogue measurements, source images, and wider sky context without selecting the same source independently in each panel.
The navigation controls can also be switched from All records to Selected, allowing the user to step only through the subset identified during visual exploration.
Annotation Workflow
The Annotations panel demonstrates how the same linked workspace can be used for manual review.
For each focused record, the user can record review information such as status, confidence, tags, and notes. The Annotation Summary panel collects these results across the dataset and can be used to create a derived dataset or export the annotations.
This example therefore demonstrates a complete image-assisted workflow:
explore catalogue measurements
     -> select interesting records
     -> browse their images
     -> inspect individual sources
     -> review and annotate
     -> export the reviewed subset
As with the photometry and spectroscopy examples, morphology_layout.json stores the workspace configuration rather than the underlying data. The zoobot_subset.fits dataset must therefore be loaded separately when reproducing the example.