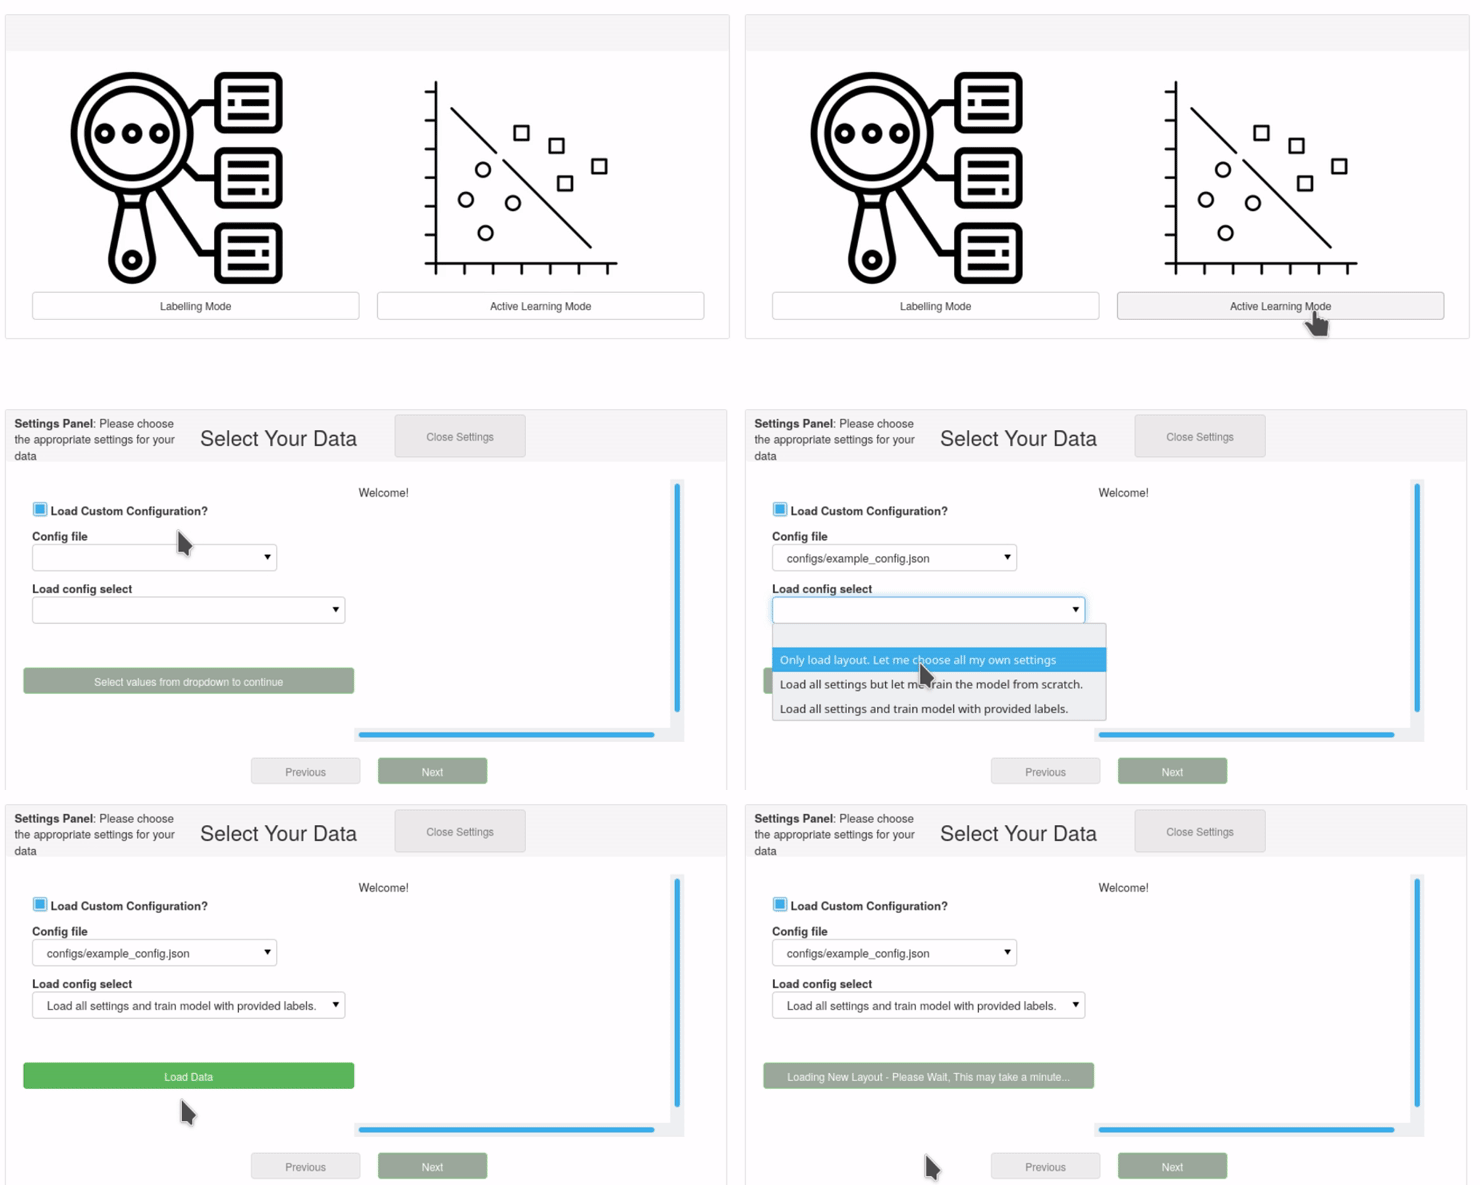
Reloading a Previous Configuration
AstronomicAL makes it easy to load a previous configuration, allowing you to continue training your model from an earlier checkpoint or to verify the results of someone else’s classifier. Your configuration is automatically saved at each active learning iteration or by clicking the Save Current Configuration button. It keeps track of your entire layout, settings, models and assigned labels and stores them within a small and easily sharable JSON file.

Below we can see the config/example_config.json provided in the repository:
{
    "Author": "",
    "doi": "",
    "dataset_filepath": "data/example_dataset.fits",
    "optimise_data": true,
    "layout": {
        "0": {
            "x": 0,
            "y": 0,
            "w": 6,
            "h": 4,
            "contents": "Active Learning"
        },
        "1": {
            "x": 6,
            "y": 0,
            "w": 6,
            "h": 4,
            "contents": "Selected Source Info"
        },
        "2": {
            "x": 0,
            "y": 4,
            "w": 3,
            "h": 3,
            "contents": "Basic Plot",
            "panel_contents": [
                "g-j",
                "y-w1"
            ]
        },
        "3": {
            "x": 3,
            "y": 4,
            "w": 3,
            "h": 3,
            "contents": "SED Plot"
        },
        "4": {
            "x": 6,
            "y": 4,
            "w": 3,
            "h": 3,
            "contents": "BPT Plots"
        },
        "5": {
            "x": 9,
            "y": 4,
            "w": 3,
            "h": 3,
            "contents": "Mateos 2012 Wedge"
        }
    },
    "id_col": "ID",
    "label_col": "labels",
    "default_vars": [
        "g-j",
        "y-w1"
    ],
    "labels": [
        0,
        1,
        2
    ],
    "label_colours": {
        "0": "#ff7f0e",
        "1": "#2ca02c",
        "2": "#d62728",
        "-1": "#1f77b4"
    },
    "labels_to_strings": {
        "0": "Star",
        "1": "Galaxy",
        "2": "QSO",
        "-1": "Unknown"
    },
    "strings_to_labels": {
        "Unknown": -1,
        "Star": 0,
        "Galaxy": 1,
        "QSO": 2
    },
    "extra_info_cols": [
        "Lx",
        "redshift"
    ],
    "extra_image_cols": [
        "png_path_DR16"
    ],
    "labels_to_train": [
        "Star",
        "Galaxy",
        "QSO"
    ],
    "features_for_training": [
        "u",
        "g",
        "r",
        "i",
        "z",
        "y",
        "j",
        "h",
        "k",
        "w1",
        "w2"
    ],
    "exclude_labels": false,
    "exclude_unknown_labels": true,
    "unclassified_labels": [],
    "scale_data": false,
    "feature_generation": [
        [
            "subtract (a-b)",
            2
        ]
    ],
    "test_set_file": false,
    "classifiers": {
        "0": {
            "classifier": [
                "RForest"
            ],
            "query": [
                "Uncertainty Sampling"
            ],
            "id": [
                "VIPERS 123044938",
                "1032524471874906112",
                "1031339472848971776",
                "0185-00395",
                "659811189332666368",
                "0211-00169",
                "2880063850911131648",
                "VIPERS 123100497",
                "0198-02511",
                "3259593556628629504",
                "4536487763679834112",
                "3640086982559899648",
                "601389188310394880",
                "8391483576654950400",
                "376114373996865536",
                "VVDS-J022540.39-042204.3",
                "326564606740817920",
                "8390233431867060224",
                "3723381311881191424",
                "316540078866327552",
                "3294552529806845952",
                "0121-00286",
                "3722278500913225728",
                "4536478967586811904",
                "336789235715565568",
                "334496204081620992",
                "1034778745740748800",
                "1035856267169523712",
                "VIPERS 124056894",
                "8145996712583557120"
            ],
            "y": [
                1,
                1,
                0,
                1,
                1,
                1,
                0,
                1,
                1,
                0,
                2,
                0,
                1,
                0,
                1,
                0,
                1,
                0,
                0,
                -1,
                0,
                0,
                0,
                0,
                -1,
                1,
                1,
                0,
                0,
                0
            ]
        }
    }
}
As you can see, all the chosen parameters from the settings panel are included in this document, which enables AstronomicAL to recreate the entire dashboard exactly how it was when the configuration was saved. This includes classifiers and the data they have been trained on, ensuring total reproducibility.
Editing The Configuration File
The configuration is entirely editable, and some users may find this a more convenient way of amending their settings.
Editing Parameters
Many changes, such as labels_to_strings and label_colours will only have cosmetic effects on the dashboard, making it simple to create plots that can be perfect for publications.
Changing parameters such as scale_data or features_for_training will affect the model specifically, so your model’s performance may be drastically different. However, this can be useful to allow for quick prototyping of model parameters.
Editing Layout
AstronomicAL allows you to rearrange any of the panels to create a dashboard that works best with your workflow. Due to a limit in the React layout we currently use, which enables movable and expandable panels, it does not currently allow for dynamic adding and removing of panels. Therefore if you would like to have extra plots on your dashboard, then editing the layout inside your configuration is the best way to do it.
Each panel is represented as follows:
{
    "5": {
        "x": 9,
        "y": 4,
        "w": 3,
        "h": 3,
        "contents": "Mateos 2012 Wedge"
    }

}
- The different parameters mean the following:
Each panel will have a string ID
x: This is the x coordinate of the top left corner of the panely: This is the y coordinate of the top left corner of the panelw: This is the width of the panelh: This is the height of the panelcontents: The plot that will be displayed when configuration loaded
To add a new panel to your layout, you will need to assign the panel to an x and y coordinate that isn’t already used. There is a width limit of 12 and so x + w <= 12. There is no limit on the y coordinate, but you will need to scroll down the page as you increase this value.
The contents parameter is the type of plot displayed when you load the configuration file. These can be any of the custom plots defined in this tutorial. If you do not know in advance what plot you want to view or you do not have the code for a particular domain-specific plot, then you can assign it as Menu.